
What a basketball box score tells you
A basketball box score records the measured contributions of each player and the totals for each team. It answers questions such as who scored, how many shots were attempted, who collected rebounds and how often the ball was lost. Reading it well means connecting those numbers instead of choosing the largest one.
Start with the competition, game date and final status. Then read minutes alongside the player’s role. A season average, a single-game total and a per-minute rate describe different things. This guide uses conventional NBA two- and three-point scoring for its worked examples; apply the rules and shot categories used by the competition you are watching.
Basketball stats abbreviations
The Jr. NBA box-score guide lists the common columns. Here is a practical reading order with the question each group helps answer.
| Column | Meaning | Read it with |
|---|---|---|
| MIN | Minutes played | Role, starts and the game’s total duration |
| PTS | Points | Field-goal and free-throw attempts |
| FGM / FGA | Field goals made / attempted | The two- and three-point split |
| 3PM / 3PA | Three-pointers made / attempted | Attempt volume and sample size |
| FTM / FTA | Free throws made / attempted | Points from the line |
| OREB / DREB / REB | Offensive / defensive / total rebounds | Available misses and team rebounding |
| AST / TOV | Assists / turnovers | Ball-handling role and attacking workload |
| STL / BLK / PF | Steals / blocks / personal fouls | The game sequence, rather than a complete defensive rating |
| +/− | Score difference during a player’s court time | Teammates, opponents and sample size |
A complete player line, worked through
Imagine a fictional guard playing 30 minutes, making 8 of 16 field goals, including 3 of 7 three-pointers, and making 4 of 5 free throws. The guard also has one offensive rebound, four defensive rebounds, six assists and two turnovers. None of these numbers describes a real player or game.
Three of the eight field goals are threes, leaving five two-point baskets. The points calculation is therefore (5 × 2) + (3 × 3) + 4 = 23 points. Do not add the three-pointers to eight made field goals again: they are already included in FGM.
| Measure | Calculation | Result |
|---|---|---|
| Field-goal percentage | 8 ÷ 16 × 100 | 50.0% |
| Three-point percentage | 3 ÷ 7 × 100 | 42.9%, rounded |
| Free-throw percentage | 4 ÷ 5 × 100 | 80.0% |
| Total rebounds | 1 + 4 | 5 |
| Assist-to-turnover ratio | 6 ÷ 2 | 3.0 |
That line suggests several productive contributions, but it does not tell us how difficult the shots were or how well the player defended. It also does not tell us whether six assists were unusually high for that player’s role. A useful evaluation combines the line with the game and a relevant longer sample.
Why field-goal percentage can mislead
Field-goal percentage treats a made two and a made three as one successful attempt each. Their scoring values differ. Two fictional players could both go 6-for-12, yet produce different point totals: six two-pointers yield 12 points, while three twos and three threes yield 15, before free throws.
Effective field-goal percentage, or eFG%, adjusts for that extra value. For the 8-for-16 example with three made threes, eFG% = (8 + 0.5 × 3) ÷ 16 × 100 = 59.4%, rounded. The formula is recorded in the NBA G League statistics glossary.
Use eFG% to compare field-goal scoring efficiency, not to describe every part of shooting. It excludes free throws. It also cannot identify whether a shot was open, heavily contested or taken because the clock was expiring. A difficult shot and an easy shot still enter the same calculation.
Rebounds: chances recovered and attacks extended
An offensive rebound comes at the attacking end after a miss; a defensive rebound ends the opponent’s chance at that missed shot. The total combines both. The distinction matters because the two actions do different jobs in a possession, as the Jr. NBA rebound guide explains.
Consider two fictional teams with 44 rebounds each. Team A has 16 offensive rebounds and 28 defensive; Team B has eight offensive and 36 defensive. Equal totals hide a different pattern. Team A recovered more of its own misses; Team B collected more at the defensive end. To judge either team fairly, also ask how many misses were available to rebound.
An offensive rebound does not automatically mean an additional completed team possession: it can extend the same possession. Avoid treating every recovered miss as proof of an extra trip down the court. For a simple game recap, describe it as another chance to score and inspect what happened next.
Assists and turnovers need a role
A lead ball-handler normally makes more decisions with the ball than a low-usage finisher. Turnovers should therefore be read with assists, minutes and role. A player with zero turnovers may have protected the ball well, but may also have handled it rarely.
The six-assist, two-turnover example gives a ratio of three assists per turnover. That is a useful description of the recorded line, not a complete grade for passing. A pass can create a good shot that is missed and produce no assist. A turnover also has a different immediate cost when it becomes an opponent fast break rather than a dead-ball restart.
What plus-minus means—and does not mean
A player at +8 was on court while their team outscored the opponent by eight. That can be useful alongside a lineup’s game pattern. It is not the number of points the player scored and not a direct count of points personally created.
For an original arithmetic example, suppose the team is ahead by two when a player enters and ahead by seven when they leave. That stint contributes +5. If the player’s next stint contributes −3, their combined figure is +2. Teammates’ makes and misses affect it too.
A strong player can finish negative in a short appearance; a quiet player can finish positive alongside a successful unit. Compare repeated combinations and larger samples before drawing a conclusion about an individual.
Combine shooting percentages from the actual attempts
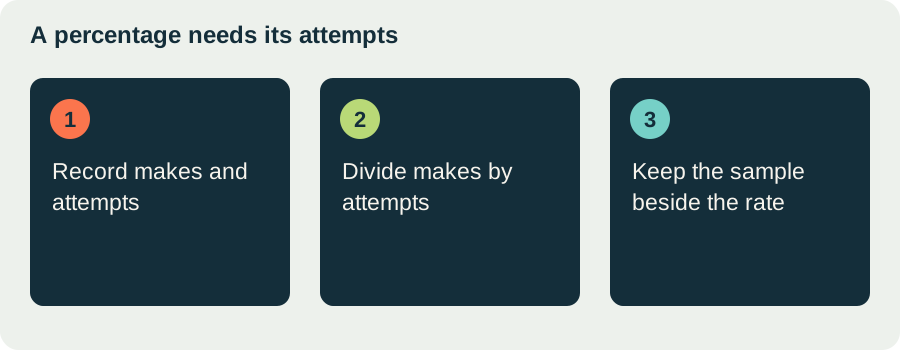
Percentages from different samples cannot normally be averaged as if the samples were equal. Imagine a fictional player makes three of five shots in one game and two of ten in the next. The individual rates are 60% and 20%. Their simple average is 40%, but the combined record is five makes from 15 attempts: 33.3%, rounded.
The second game carries twice as many attempts as the first. Adding makes and attempts before dividing keeps that difference. The same principle applies when combining player lines into a team figure or comparing a month with a full season. A displayed percentage has a denominator even when that denominator is not beside it.
When a player takes no shots in a category, zero makes from zero attempts does not provide a shooting percentage to evaluate. A dash or an unavailable value should not be read as evidence that the player missed every attempt. There were no attempts in that category to convert.
True shooting percentage brings free throws into the question
Effective field-goal percentage adjusts field goals; true shooting percentage, usually TS%, also incorporates free-throw scoring. The conventional formula in the league statistics glossary is PTS ÷ [2 × (FGA + 0.44 × FTA)], expressed as a percentage. The 0.44 term is an estimate used by this measure, not a count of the exact possessions in an individual game.
For our fictional 23-point guard with 16 field-goal attempts and five free-throw attempts, TS% is 23 ÷ [2 × (16 + 0.44 × 5)] × 100. The denominator is 36.4, producing approximately 63.2%. That is a different question from the player’s 50% field-goal conversion rate, not a competing account of how many shots went in.
A percentage above a familiar field-goal range is not automatically an error in this measure. TS% relates points to an adjusted shooting denominator, rather than simply counting successful field goals out of attempts. Keep the name of the measure with the number when comparing two players.
Per-minute production is a rate, not a promised total
A per-36-minute rate scales a contribution to a common minutes basis. If a fictional player scores 18 in 24 minutes, the rate is 18 ÷ 24 × 36 = 27 points per 36 minutes. Another player scoring 24 in 36 minutes has the larger actual total, but the lower rate in these two appearances.
Both statements can be true. The first player did not actually score 27. Extending a rate into more minutes assumes the conditions would remain comparable, which is rarely something a box score can establish. Fatigue, matchups and a different role can change the opportunities available.
Use rates to make a comparison more precise, while retaining the underlying minutes. A very short appearance can produce an eye-catching scaled rate after only a few events. The practical reading is the rate together with its sample, rather than replacing the actual performance with an extrapolation.
A team can win with a lower field-goal percentage
The following fictional team lines use ordinary NBA scoring. They show why the total number and value of successful shots matter alongside conversion rate.
| Measure | Team A | Team B |
|---|---|---|
| Field goals | 38 of 85 | 40 of 80 |
| Field-goal percentage | 44.7% | 50.0% |
| Made three-pointers, included in field goals | 12 | 8 |
| Made free throws | 20 | 15 |
| Total points | 108 | 103 |
The table does not explain where A’s five additional field-goal attempts came from. To investigate that, check turnovers, rebounding and the play-by-play. A calculation can establish how the points add up without establishing the reason every opportunity existed.
Tell a team contribution from an individual award
A useful action does not always produce an obvious individual statistic. A teammate may set a screen that creates a clean shot, force a difficult attempt through positioning or make the pass before the assist. Counting only the final recorded action can overlook the shared work that made it possible.
This does not make the recorded assist or rebound meaningless. It defines what the number measures. Treat a scoring leader as the leader in recorded points, not automatically the player responsible for every good possession. Treat a low-scoring defender’s line as incomplete evidence about defensive influence, rather than evidence of no influence.
For a close comparison, choose one or two sequences from the game and ask how the recorded line reflects them. Does it show the final result of the action, the attempt, or neither? This turns the box score into a guide for observation instead of asking it to replace observation.
Build an honest player comparison
Write the comparison in a single sentence before gathering more columns. “Which player converted field-goal attempts more efficiently?” needs a shooting measure and its attempts. “Who contributed more actual scoring in this game?” needs points. “Who sustained production across a longer workload?” needs minutes and a suitably defined sample.
If two columns appear to disagree, identify the different questions behind them. More points can coexist with lower efficiency; more rebounds can coexist with more missed shots available; a higher assist total can coexist with a larger ball-handling workload. Naming the denominator often resolves the apparent conflict.
Finally, keep the comparison within a relevant competition and period. A career total is not a single-game achievement, and a playoff average is not a regular-season average. Attach those labels so another reader can understand and reproduce the comparison without guessing which filters were used.
Record a rate with the count used to produce it
For any rate you calculate yourself, write its numerator and denominator. Suppose one fictional team commits two turnovers across 80 assumed possessions and another commits three across 120. As simple descriptive counts per 100 of those assumed possessions, both equal 2.5. The second team has more turnovers in total but the same rate under this calculation.
This is a demonstration of scaling, not an official possession estimate for an actual game. If you use a published metric with a similar name, check that its definition uses the same denominator. A number can be arithmetically correct and still be the wrong comparison because a provider counts its opportunities differently.
Keeping the inputs beside the rate also makes rounding easier to understand. The displayed answer is a convenient summary; the underlying count remains the basis for combining or checking it.
From a box score to a better game explanation
- Read the final score and any overtime first.
- Compare shots made and attempted, not makes alone.
- Separate long-range scoring and free throws.
- Check whether turnovers or offensive rebounds changed the chances available.
- Read player totals with minutes and role.
- Use the play-by-play or video for the key sequence the table cannot explain.
Use this method for NBA results and quarter scores, and adapt the categories when following the PBA. A box score becomes most useful when it helps you ask a more precise question about the game.