
Betting odds combine a potential payout with an implied probability. Decimal odds of 2.50 mean a successful 100-unit stake returns 250 units in total, including the original stake. The net profit would be 150 units; a losing selection would lose the 100-unit stake. The same price corresponds to an implied probability of 40%.
Those are three different statements: total return, net profit and implied probability. Keeping them separate makes it easier to understand an odds display without treating it as a prediction. Every example below is hypothetical and uses units rather than a recommended amount of money.
How decimal odds work
Decimal odds include the returned stake in the displayed multiplier. For odds d and stake s, total return on a successful selection is s × d. Net profit is s × (d − 1). These simplified calculations assume an ordinary winning single selection, with no commission, deductions or special promotion.
| Decimal odds | Total return if successful | Net profit if successful | Loss if unsuccessful |
|---|---|---|---|
| 1.25 | 125 units | 25 units | 100 units |
| 1.80 | 180 units | 80 units | 100 units |
| 2.00 | 200 units | 100 units | 100 units |
| 2.50 | 250 units | 150 units | 100 units |
| 5.00 | 500 units | 400 units | 100 units |
At 1.25, a 100-unit stake does not make 125 units of profit. The extra amount is only 25. Confusing return with profit can make a small payout look much larger than it is. Change the inputs in our decimal odds calculator to compare the two outputs side by side.
Implied probability: the 100 ÷ odds formula
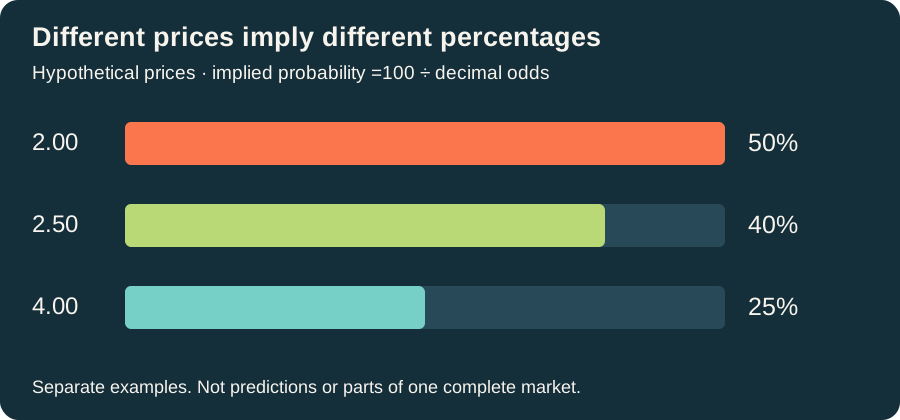
The implied probability percentage is 100 ÷ decimal odds. At 2.50, 100 ÷ 2.50 = 40%. At 1.25, it is 80%. The NSW Office of Responsible Gambling’s maths material explains this relationship between decimal odds and probability.
A useful check is the reverse calculation: fair decimal odds for a stated probability are 100 divided by that probability percentage. A hypothetical 25% probability corresponds to 4.00; 50% corresponds to 2.00. This reverse calculation assumes the probability is already known. It does not explain how to estimate that probability for a real match.
Nor does 40% mean that exactly four of the next ten selections will win. Even a genuinely repeated event with a fixed probability can produce clusters of wins and losses. Sporting events are less uniform: opponents, line-ups and conditions can differ between matches.
Fractional and American odds compared
Different formats can express the same payout. Fractional odds a/b show profit of a for every b staked; their decimal equivalent is 1 + a ÷ b. Positive American odds show the profit on 100 units. Negative American odds show the stake required for 100 units of profit.
| Decimal | Fractional | American | Implied probability |
|---|---|---|---|
| 1.50 | 1/2 | −200 | 66.67% |
| 2.00 | 1/1 | +100 | 50.00% |
| 2.50 | 3/2 | +150 | 40.00% |
| 4.00 | 3/1 | +300 | 25.00% |
For a positive American price A, decimal odds are 1 + A/100. For a negative price, use 1 + 100/|A|. Thus −200 becomes 1 + 100/200 = 1.50. A negative American number does not mean a negative payout. Our table is a format comparison, not a list of current offers.
Bookmaker margin and overround
In a complete market, add the implied probabilities of all mutually exclusive outcomes. A total above 100% shows an overround. For hypothetical prices of 1.80 on each side of a two-outcome market, each side implies 55.56%. The combined book is 111.11%; its excess above 100% is 11.11 percentage points.
Terminology varies: a source may call the complete 111.11% book the overround, while another uses the term for the 11.11-point excess. State which measure you mean. Betfair’s overround explanation illustrates the sum-of-probabilities method.
For another original example, prices of 1.80 and 2.20 imply 55.56% and 45.45%. Their combined total is 101.01%. Proportionally dividing each implied probability by that total gives 55% and 45%. That removes the excess mathematically under one simplifying assumption: it distributes margin proportionally. It is not proof that the true chances are 55% and 45%, or that the operator earns exactly 1.01% on every event.
Why the market rules matter as much as the number
A basketball winner market that includes overtime is not identical to a regulation-only market with a draw option. A tennis match winner and first-set winner are different questions. You cannot compare their prices simply because the same opponents appear beside them.
If a three-outcome market includes home, draw and away, use all three prices when calculating the book. Leaving out the draw makes the total artificially small. Likewise, a handicap must be read with its number: a price on one team at −3.5 is not the same proposition as that team simply winning.
Void selections, pushes, retirements, abandoned events, exchange commission and cash-out offers can change settlement. The basic return formula does not predict which rule applies. Read the market definition and current operator terms separately from the arithmetic.
Shorter odds do not make an outcome certain
A short-priced favourite can lose, and a long-priced outsider can win. A single result does not settle whether the original probability estimate was sensible. Consider a fictional event assigned an 80% chance: the remaining 20% is still part of the forecast, rather than an exception that makes the forecast meaningless.
A change from 2.50 to 2.00 raises the implied probability from 40% to 50%. The price has shortened; the potential return for an identical winning stake has fallen. That movement alone does not identify its cause. It could reflect information, trading decisions or market activity, and it should not be presented as a guarantee about the match.
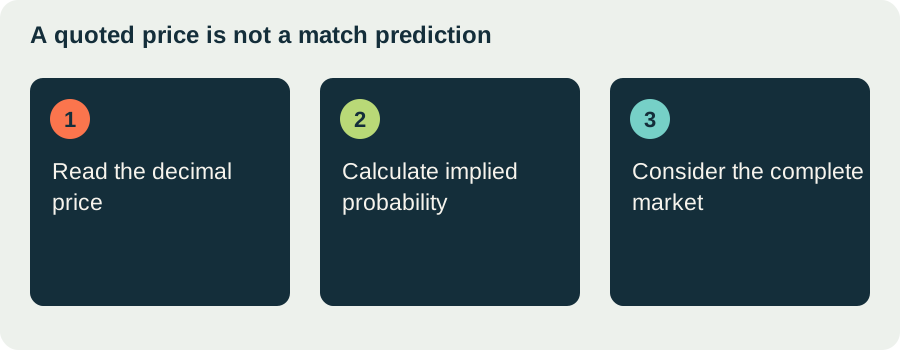
A price, an estimate and a result are three different records
The price is the number offered for a particular selection under particular conditions. An estimate is someone’s assessment of the chance that the selection succeeds. The result is what actually happens. Confusion begins when any one of those is treated as a complete substitute for the others.
Suppose a fictional selection is priced at 2.50. Its implied probability is 40%, but that fact alone does not establish that 40% is the true chance. If the selection wins, the result also does not establish that its chance was 100%. An uncertain event can produce either outcome. To assess an estimate, you need a meaningful body of forecasts and results, plus a clear explanation of what was predicted.
A complete market must describe every relevant outcome
Mutually exclusive outcomes cannot both win under the market definition. Collectively exhaustive outcomes cover everything that can happen within that definition. You need both properties before treating a group of implied probabilities as a complete book. Two team names on a screen do not prove that a draw has been excluded by the rules.
Consider a hypothetical three-outcome market: A wins at 2.40, draw at 3.20, B wins at 3.00. The implied percentages are approximately 41.67%, 31.25% and 33.33%. Their total is 106.25%, an excess of 6.25 percentage points. Omitting the draw would produce 75%, but that would describe an incomplete list, not a different operator margin.
The arithmetic becomes meaningful only after the outcomes have been defined. A regulation-time draw and a winner after overtime answer different questions. A selection that can push or become void also needs its settlement conditions understood before a simple win-or-lose explanation is treated as complete.
Expected value explains an average, not a promise
Expected value combines possible net outcomes with their probabilities. The OpenStax explanation of expected value describes the probability-weighted average. It is not a forecast of the precise amount that will happen on the next trial.
For an original simplified example, assume a known 40% chance of success, odds of 2.50 and a hypothetical 100-unit stake. Success produces 150 units of profit and failure loses 100. The expected net outcome is 0.40 × 150 + 0.60 × (−100), which equals zero. The actual individual result is still plus 150 or minus 100, not zero.
If the assumed chance is instead 35%, the same calculation gives 0.35 × 150 − 0.65 × 100 = −12.50 units. Changing the probability assumption changes the conclusion even though the payout price has not moved. This is why a calculator that knows only the odds cannot independently decide whether a real selection has a favourable expected value. The difficult, uncertain input is the probability, not the multiplication.
A small sample can tell an incomplete story
Even when an experiment has a stable probability, a short sequence need not resemble that percentage closely. Sport adds further complications because fixtures are not identical repetitions: opponents, circumstances and available information change. A record of two wins from three selections therefore should not automatically be relabelled as a proven 66.67% forecasting ability.
When comparing a claim about past performance, ask what was included. Were all selections recorded before the events? Are losing examples retained? Were the quoted prices actually available at the stated time? Are the market and settlement definitions consistent? These questions do not establish that a method works; they show what evidence would be needed before a strong performance claim deserves confidence.
Combining outcomes does not remove uncertainty
A team’s win and the same team’s scoring total can be connected through the same match. Treating them as unrelated merely because they have separate labels can distort a combined calculation. The same caution applies to multiplying displayed odds and then calling the answer a proven probability. The combined market’s actual rules and pricing need to be considered; this guide does not supply an accumulator or bet-builder forecast.
Percentage points and percentage changes are not interchangeable
A move in implied probability from 40% to 50% is an increase of ten percentage points. Relative to the original 40%, it is a 25% increase. Both calculations can describe the same movement, but they use different denominators. State which one you mean instead of using “ten percent” for both.
In a market example, decimal odds shortening from 2.50 to 2.00 lower the total return on a hypothetical 100-unit winning stake from 250 to 200. That is a reduction of 50 units, or 20% of the earlier return. The implied probability rises at the same time. Neither change tells you, on its own, what information or trading decision produced the new price.
Settlement can change what “return” means
The ordinary decimal formula assumes a winning cash stake returned with its profit. A void selection, a push, commission, a deduction or a promotional stake may follow another settlement arrangement. Before comparing a displayed estimate with a paid amount, identify whether the case still fits that ordinary assumption.
For example, “stake not returned” in a promotional token’s conditions changes which part of the multiplier becomes a withdrawable return. It is not an instruction to change every decimal calculation. Different funding types and conditions must stay distinct. Our promotion-terms guide explains the vocabulary without claiming that a particular current offer uses a particular rule.
Use odds literacy without turning it into a betting plan
Understanding a price can help you spot a misleading payout claim, distinguish profit from returned money and notice when a comparison leaves out an outcome. None of those skills requires an account or a stake. A numerical example is useful even when the reader decides not to gamble.
A system that increases a stake after losses changes the amount exposed; it does not make a lost amount part of the next event’s payout entitlement. Nor does a losing run create a debt that sport must repay. Keep the mathematical question separate from the pressure to recover money. If that pressure is driving decisions, the relevant next step is distance and support, not a more elaborate calculation.
Common questions about odds
Does a bigger decimal number mean a more likely winner?
No. Bigger decimal odds imply a lower probability and a larger conditional payout. At 5.00 the implied probability is 20%; at 1.25 it is 80%.
Is overround the same as a guaranteed operator profit?
No. It describes the offered prices in a complete market. Actual profit depends on stakes, payouts, settlement and costs. It is not the same as a measured return from a completed set of transactions.
Can the calculator tell me which selection to choose?
No. It reads the inputs you supply and checks arithmetic. It does not estimate a team’s strength, test a prediction or recommend a stake. Gambling is not a dependable source of income; the responsible gambling page explains the distinction between understanding prices and deciding to risk money.